The flow of people across the U.S. border has long shaped both policy and public discourse, with recent years witnessing dramatic fluctuations driven by key policy changes. From the rollback of the “Remain in Mexico” policy to new border security legislation, these shifts have directly influenced the number of border encounters. In this article, we take a data-driven look at U.S. border encounters from 2021 to 2024, analyzing patterns and challenges, and offering a forecast for 2025. This clear, unbiased analysis sheds light on the evolving landscape of U.S. border activity and migration trends.
Fluctuations in U.S. Border Encounters: 2021 to 2024
Policies play a critical role in shaping migration patterns by influencing the decisions of individuals and groups seeking to migrate, as well as the strategies they use to enter other countries. Migration policies, whether they focus on border security, asylum processing, visa regulations, or enforcement priorities, directly affect the timing, volume, and routes of migration flows.
Source: U.S. Customs and Border Protection. “Nationwide Encounters.”
From 2021 to 2024, the number of encounters experienced significant fluctuations, largely influenced by shifts in U.S. immigration policies. Between 2021 and 2022, encounters saw a sharp increase of 41.4%, likely driven by the rollback of the “Remain in Mexico” policy and changes to Title 42, which allowed more migrants to remain in the U.S. while awaiting asylum decisions. The growth continued from 2022 to 2023, but at a slower pace, with a 15.7% rise. However, from 2023 to 2024, there was a reversal, with encounters decreasing by 13.9%. A key reason for this 2024 decrease might be the introduction of the Emergency National Security Supplemental Appropriations Act, 2024, a bipartisan legislative package introduced on February 4, 2024. This bill, developed by U.S. senators, including James Lankford (R Oklahoma), Kyrsten Sinema (I-Arizona), and Chris Murphy (D-Connecticut), reformed border security and the asylum process. In response to high levels of encounters, the bill represented the most significant changes to immigration policy in thirty years, transforming how border officials manage migrants requesting humanitarian protection and tightening overall security measures. 1 These reforms, along with geopolitical factors such as global conflicts and securitization of migration in key regions, contributed to the reduction in encounters at the U.S. border in 2024.
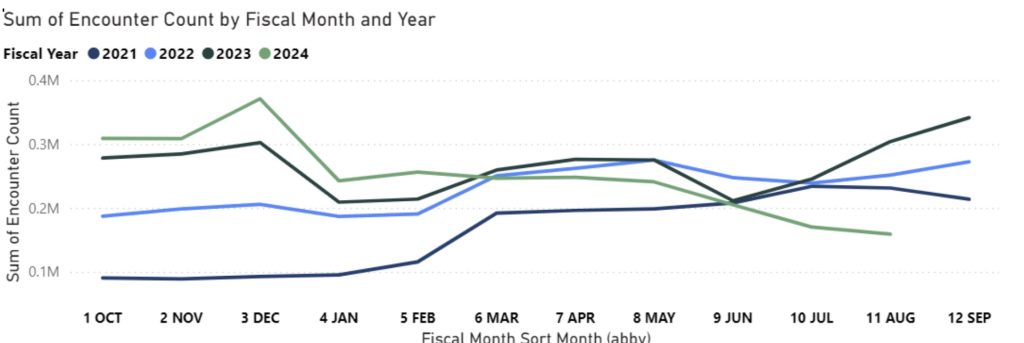
Seasonal Shifts in Migration Encounters: Key Trends from 2021 to 2024
The distinct seasonal trends in migration encounters from 2021 to 2024 reveal key shifts in migration patterns. Fall and winter have become increasingly important periods, with a significant rise in encounters average during these seasons. The fall season, in particular, saw steady growth, peaking at 246 encounters in 2024, while winter also experienced a sharp increase, reaching 234 that same year. In contrast, the notable drop in summer encounters to 141 in 2024 may reflect changes in border enforcement or possibly unfavorable travel conditions, such as extreme weather. Spring encounters remained relatively stable, with only moderate fluctuations across the years. These trends suggest that migration patterns may be adapting to changing conditions or enforcement strategies, with a growing concentration of activity in the fall and winter months. The sharp decline in summer encounters, paired with the rise in fall and winter, signals a potential shift in seasonal migration behaviors.

Encounter Trends for Top Citizenship Groups and Border Regions
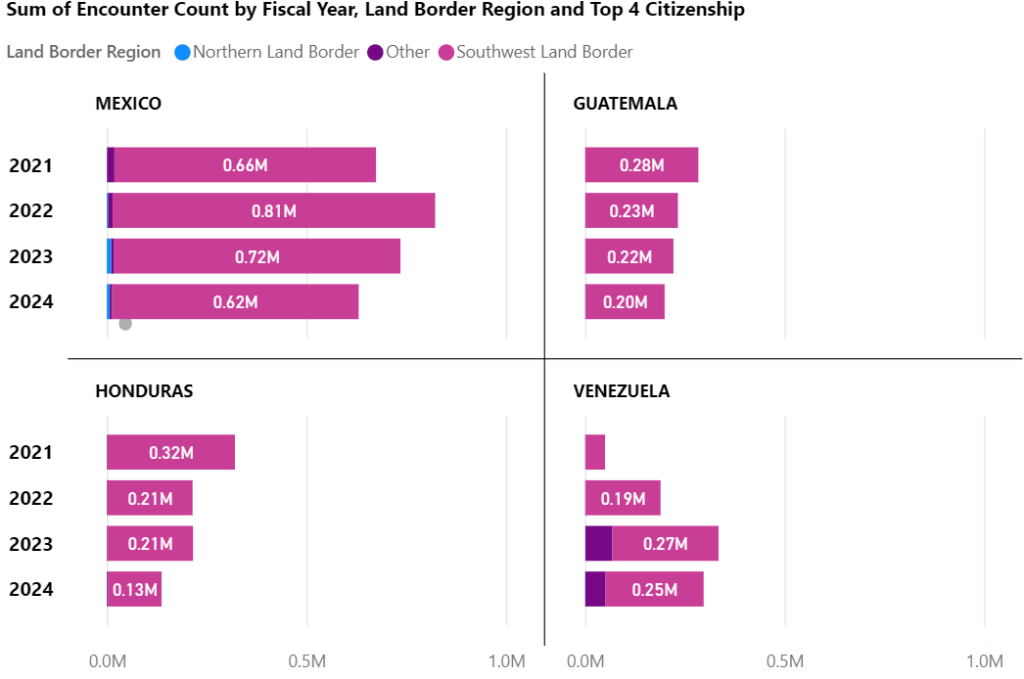
From 2021 to 2024, Mexico consistently recorded the highest number of encounters at U.S. borders. Several factors contribute to this trend one of them the geographic proximity. Mexico’s location directly adjacent to the U.S. makes it a primary country for both legal and unauthorized migration. This proximity facilitates higher numbers of encounters at the U.S.-Mexico border.
Mexico has the highest number of encounters, with a total of 2,865,028, followed by Guatemala (939,012), Honduras (889,457), and Venezuela (872,484). In terms of areas of responsibility, the Rio Grande Valley Sector leads with 1,485,949 encounters, followed by the Del Rio Sector (1,370,629) and 2 the Tucson Sector (1,269,361). Regarding land border regions, the Southwest Land Border dominates with 8,622,559 encounters, significantly surpassing other regions.
For the top citizenships (Mexico, Guatemala, Honduras, and Venezuela), key areas and border regions where their encounters occurred include the Rio Grande Valley Sector (Southwest Land Border), where Guatemalan citizens had the highest encounters at 289,593, followed by the Tucson Sector with 249,570 encounters. Mexican citizens primarily had encounters in the Southwest Land Border, with the top sectors being Tucson (734,595), El Paso (380,694), San Diego (355,571), Del Rio (291,984), and Rio Grande Valley (230,804). Honduran citizens were also mainly encountered in sectors like Del Rio and Rio Grande Valley within the Southwest Land Border. Venezuelan citizens, while having fewer encounters overall, were encountered in various regions, including sectors like Miami and San Diego. The Southwest Land Border remains the dominant region for encounters across these top citizenships.
Source: U.S. Customs and Border Protection. “Nationwide Encounters.”
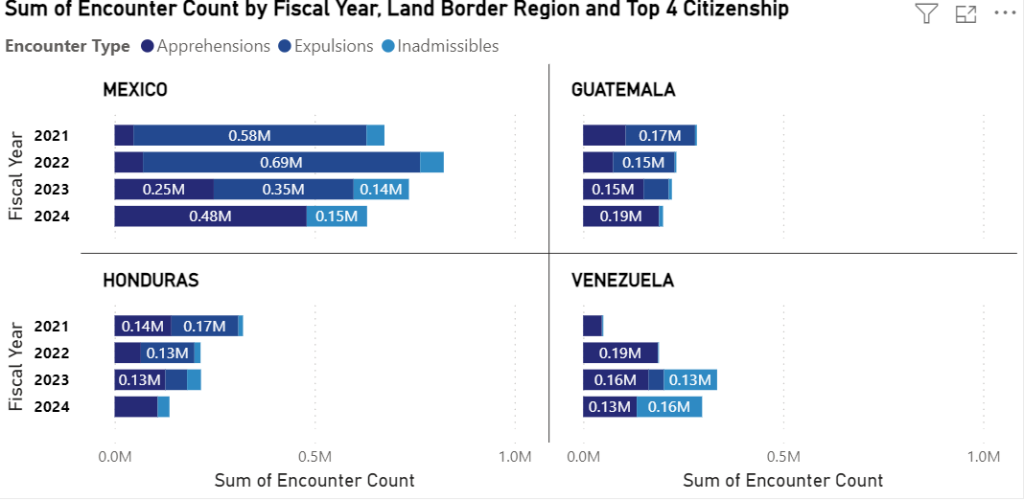
Encounter type trends per citizenship shows a sharp rise in apprehensions for Mexico, from 47,136 in 2021 to 480,324 in 2024, with Guatemala and Honduras also increasing, and Venezuela peaking in 2022 but declining by 2024. Expulsions peaked for Mexico in 2022 (693,044) before dropping, with similar trends for Guatemala and Honduras, while Venezuela saw fewer expulsions overall. inadmissible steadily increased for Mexico and Venezuela, with Guatemala and Honduras showing lower but gradually rising inadmissible encounters over time.
Source: U.S. Customs and Border Protection. “Nationwide Encounters.”